
Chemical Market Weekly | 2026-10-27: Q1-Q3 GDP Up 4.6%, Wind and Solar Capacity Tops 2.01 Billion kW, EU27 Chemical Production Down 2.0% YoY
10/27/2026
China's statistics bureau, customs administration and energy administration released a wave of first-three-quarter data this week: GDP reached CNY 107.1 trillion, up 4.6% year on year; value added of industrial enterprises above the designated size grew 5.3%, with high-tech manufacturing up 14.3%; goods trade reached CNY 39.94 trillion in the first three quarters, up 18.8%; and cumulative installed capacity of wind and solar power exceeded 2.01 billion kW. Overseas, EU27 chemical production fell 2.0% year on year in January-July, and global output growth slowed. The summary below is organized into five sections: Domestic Macro, Prices and Costs, Trade and Exports, Energy and Power, and Overseas Markets.
Domestic Macro: GDP Grows 4.6% in First Three Quarters, High-Tech Manufacturing Up 14.3%
First-three-quarter GDP reached CNY 107.1 trillion, up 4.6% year on year. According to the National Bureau of Statistics (NBS), GDP in the first three quarters was CNY 107.1 trillion, up 4.6% year on year at constant prices; by quarter, Q1 grew 5.0%, Q2 4.3% and Q3 4.5%. NBS Deputy Director Sheng Laiyun said at the press conference that the GDP increment over the first three quarters was about CNY 5.7 trillion, the largest for the same period in five years. The expansion of aggregate output keeps maintenance, expansion and supporting demand active for existing units and for storage tanks and heat-exchange systems in chemicals and equipment manufacturing. Source: gov.cn
Value added of industrial enterprises above the designated size grew 5.3% in January-September. NBS data show that in the first nine months, value added of industrial enterprises above the designated size rose 5.3% year on year, with September up 5.5%; equipment manufacturing grew 10.2% and high-tech manufacturing 14.3%. By product, 3D printing equipment output rose 62.5%, lithium-ion batteries 39.5% and industrial robots 29.1%. Over the same period, fixed-asset investment was CNY 33.4 trillion, down 7.2%. The expansion of high-tech manufacturing and new-energy equipment directly drives renewal demand for reactors, mixing and grinding equipment. Source: National Bureau of Statistics
Prices and Costs: September PPI Up 5.0% YoY, Chemical Feedstock Purchase Prices Up 12.6%
The September producer price index (PPI) rose 5.0% year on year. NBS data show that September PPI rose 5.0% year on year and 1.2% month on month; the purchase price index for industrial producers rose 6.9% year on year. On a January-September average basis, PPI was up 2.3%. By segment, September ex-factory prices for chemicals and chemical products manufacturing rose 12.1% year on year, and purchase prices for chemical feedstock rose 12.6%. Higher raw-material costs directly affect stainless steel plate procurement budgets in equipment manufacturing; downstream buyers of mixing tanks, storage tanks and other equipment should factor material grade and lead time into price expectations. Source: National Bureau of Statistics
Trade and Exports: First-Three-Quarter Trade Hits CNY 39.94 Trillion, September Tops CNY 5 Trillion for the First Time
First-three-quarter goods trade reached CNY 39.94 trillion, up 18.8% year on year. General Administration of Customs data show exports of CNY 23.2 trillion, up 16.4%, and imports of CNY 16.74 trillion, up 22.3% in the first three quarters; September trade was CNY 5.16 trillion, up 27.5% year on year, the first month ever above CNY 5 trillion. By product, integrated circuit exports rose 99.1%, electric vehicles 72.3% and lithium batteries 36.4% in the first three quarters. Strong export momentum lifts packaging, storage and line-support demand downstream of chemicals, with rising inquiries for stainless steel storage tanks, metering and conveying upgrades. Source: Xinhuanet
Energy and Power: Wind and Solar Capacity Tops 2.01 Billion kW, Power Use Up 3.9%
Cumulative installed capacity of wind and solar power exceeded 2.01 billion kW. National Energy Administration data show that as of end-September, cumulative installed capacity of wind and solar power stood at 2.01 billion kW, of which solar was 1.31 billion kW, up 16.5% year on year, and wind 700 million kW, up 20.4%; about 170 million kW was added in January-September. Wind and solar generated 1,933.3 billion kWh in the first three quarters, and the increment accounted for 64% of the growth in total social power consumption. Capacity expansion along the new-energy chain keeps equipment investment active in lithium-battery materials and PV auxiliary materials, sustaining strong demand for dispersers, sand mills and other grinding-dispersion equipment. Source: Xinhuanet
Total social power consumption reached 807.34 billion kWh in January-September, up 3.9% year on year. National Energy Administration data show that social power use in the first three quarters was 8.07 trillion kWh, up 3.9%, with September at 899.7 billion kWh, up 1.2%. Power use by high-tech and equipment manufacturing rose 8.7% and by charging and swapping services 55.4%. The shift of manufacturing power use toward high-tech segments indicates active downstream operations in equipment and electronics, supporting demand for chemical equipment and complete line packages. Source: Xinhuanet
Overseas Markets: EU27 Chemical Production Down 2.0% YoY, Global Output Growth Slows
EU27 chemical production fell 2.0% year on year in January-July. The latest Chemical Trends Report from the European Chemical Industry Council (Cefic) shows EU27 chemical production down 2.0% year on year in January-July 2026, with the July output index easing to 82.8 from 84.2 in June; global chemical output rose 1.0% over the same period, of which China grew 3.8%, with an output index of 138, well above the global average of 111. Weak European operating rates contrast with relatively strong Chinese demand, and against the backdrop of import substitution and equipment localization, domestic chemical equipment makers face structural supporting opportunities. Source: Cefic
Euro area industrial output fell 0.5% month on month in August. Eurostat data show that in August 2026, seasonally adjusted industrial production fell 0.5% in the euro area and 0.3% in the EU month on month; year on year, the euro area was down 1.1% and the EU down 0.2%. Weak euro-area industrial conditions and continued contraction of overseas chemical capacity open demand space for domestic non-standard customization and complete line exports. Source: Eurostat
Further reading: - Chemical Market Weekly 2026-10-26: Hengyi Q3 Net Profit Expected to Surge Over 33-Fold, Asian Methanol Benchmark Rises to USD 700/tonne, September Crude Processing Falls 8.4% YoY - Chemical Market Weekly 2026-10-19: High Oil Prices Support Petrochemical Costs, PPI Chemical Feedstocks Up 12.6% YoY, Methanol and Styrene Shift Higher
This report is compiled by Hyline Shengda Equipment Manufacturing Co., Ltd. (hyline.cn); information ownership belongs to the original authors. The company specializes in stainless steel reactors, mixing tanks, storage tanks, dispersers, concentrators and complete chemical line support, including non-standard customization.
Related Products
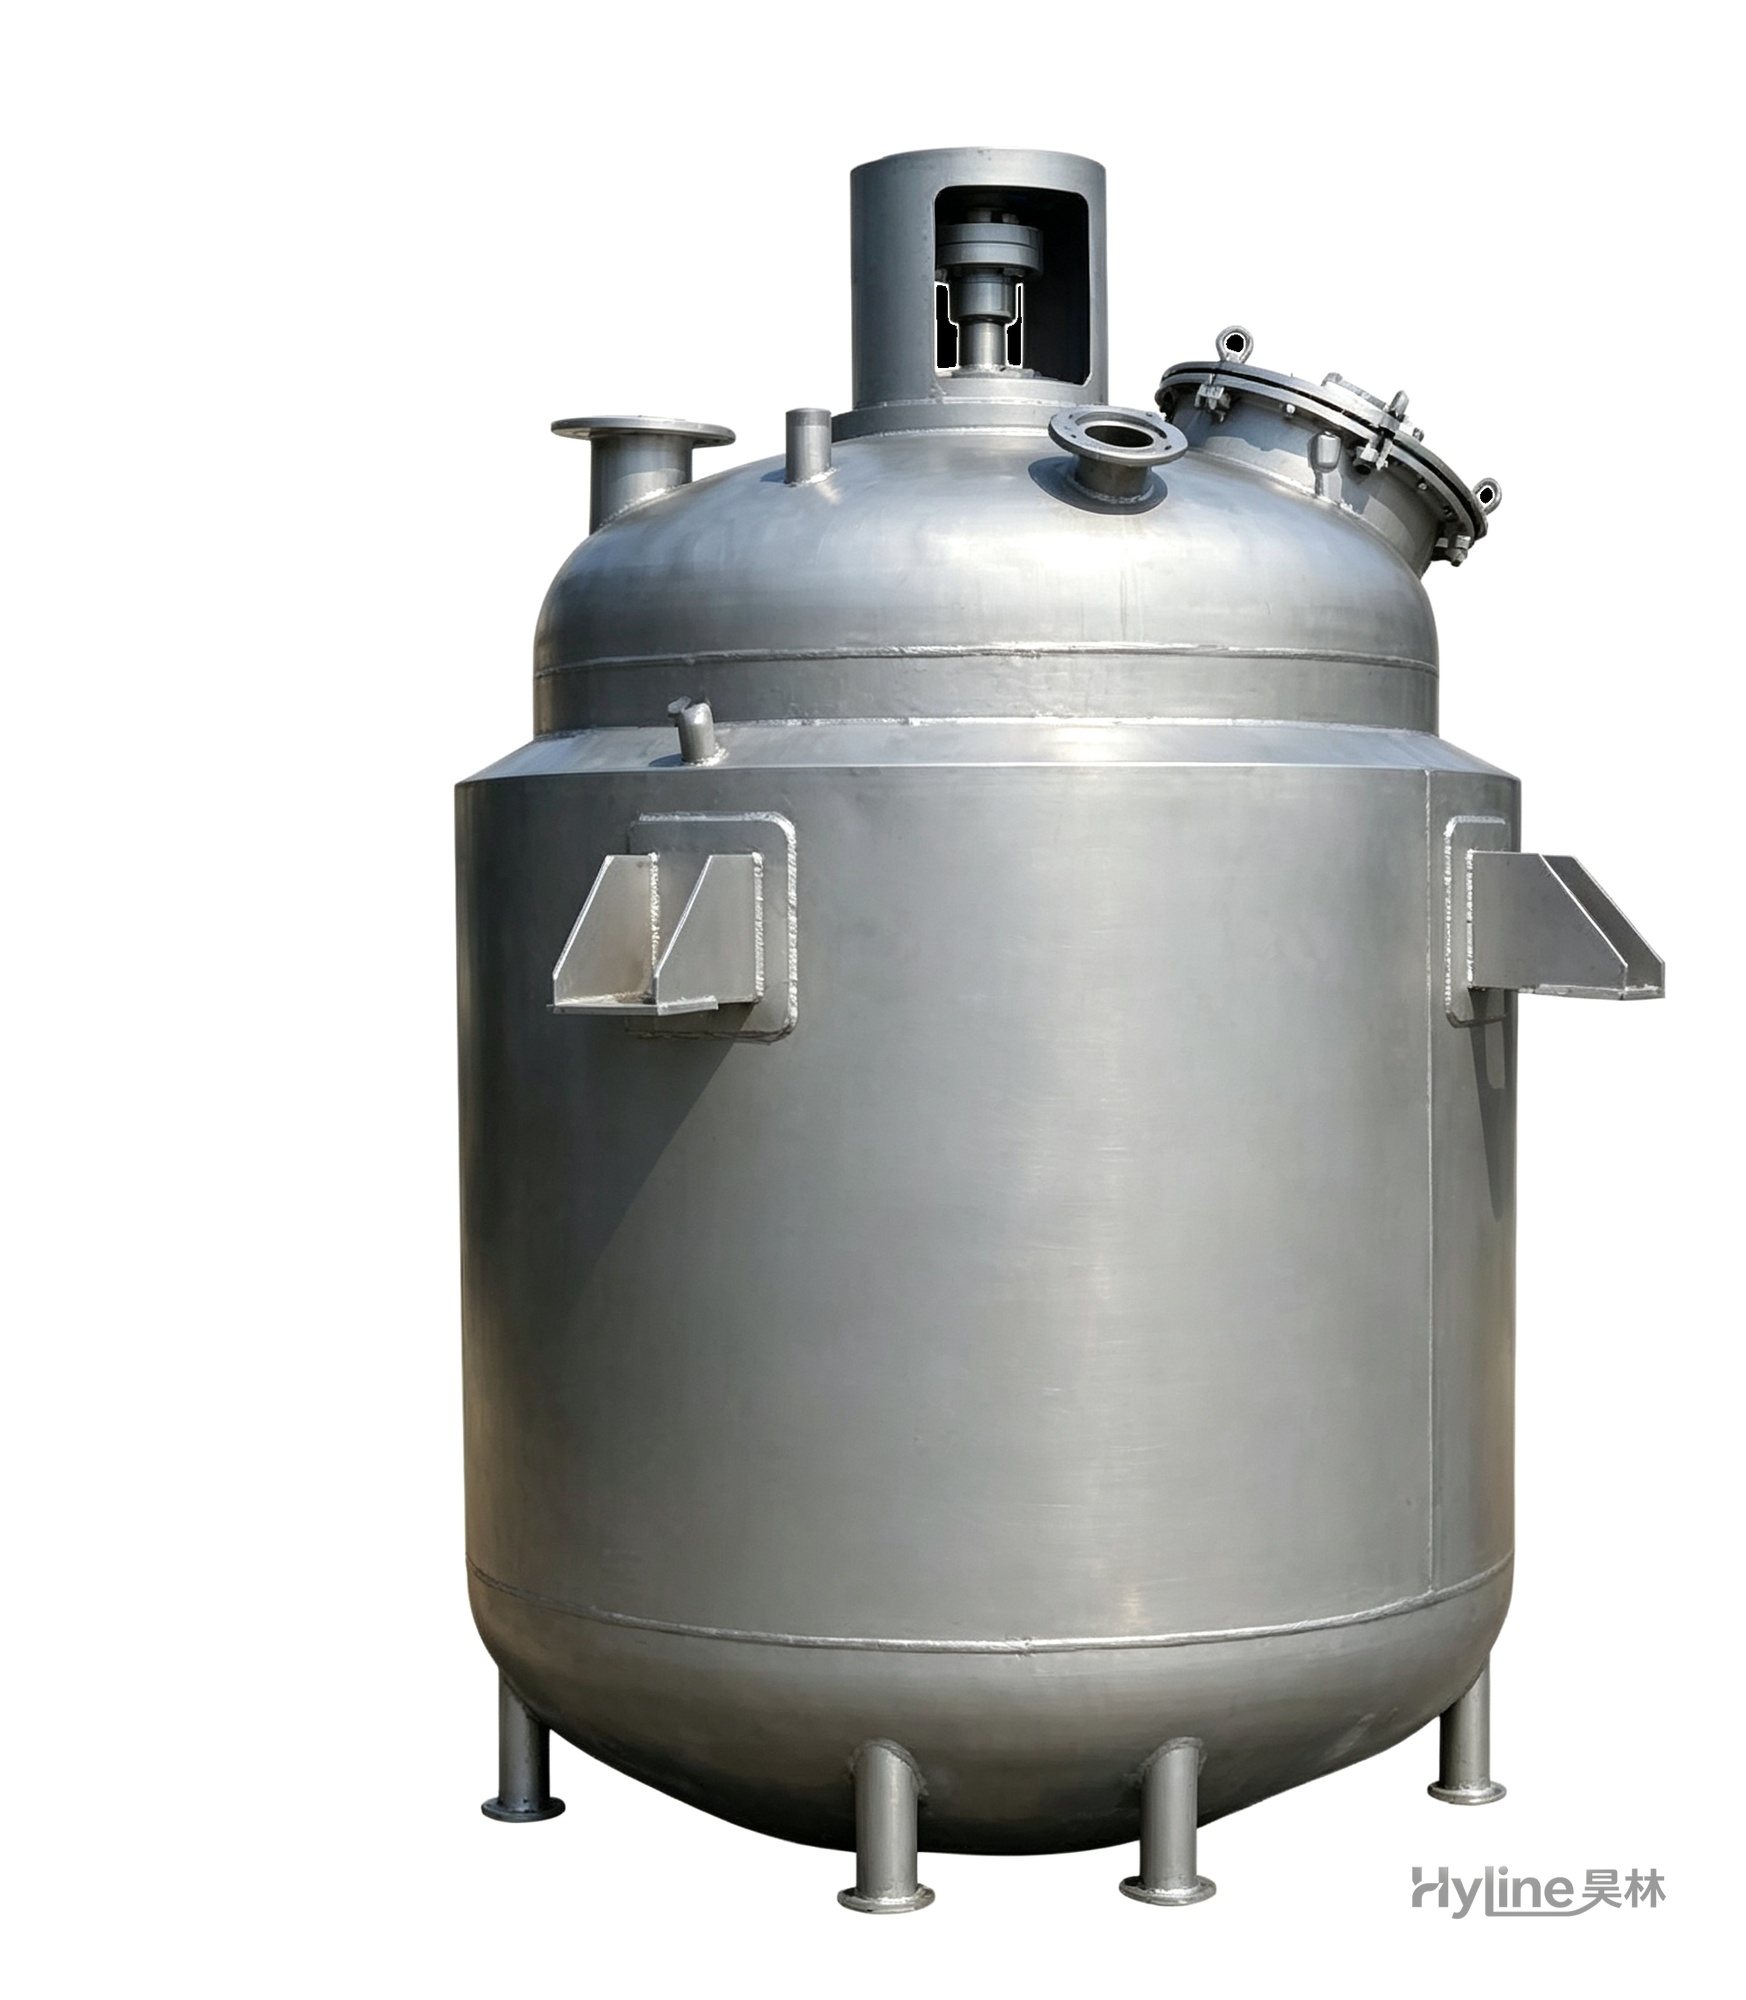
Jacketed Reactor
The typical main reaction vessel in chemical production. Mixing, heating and cooling disperse and mix materials for reaction and polymerization. The jacket circulates thermal oil/steam for heating or cooling water for temperature control.
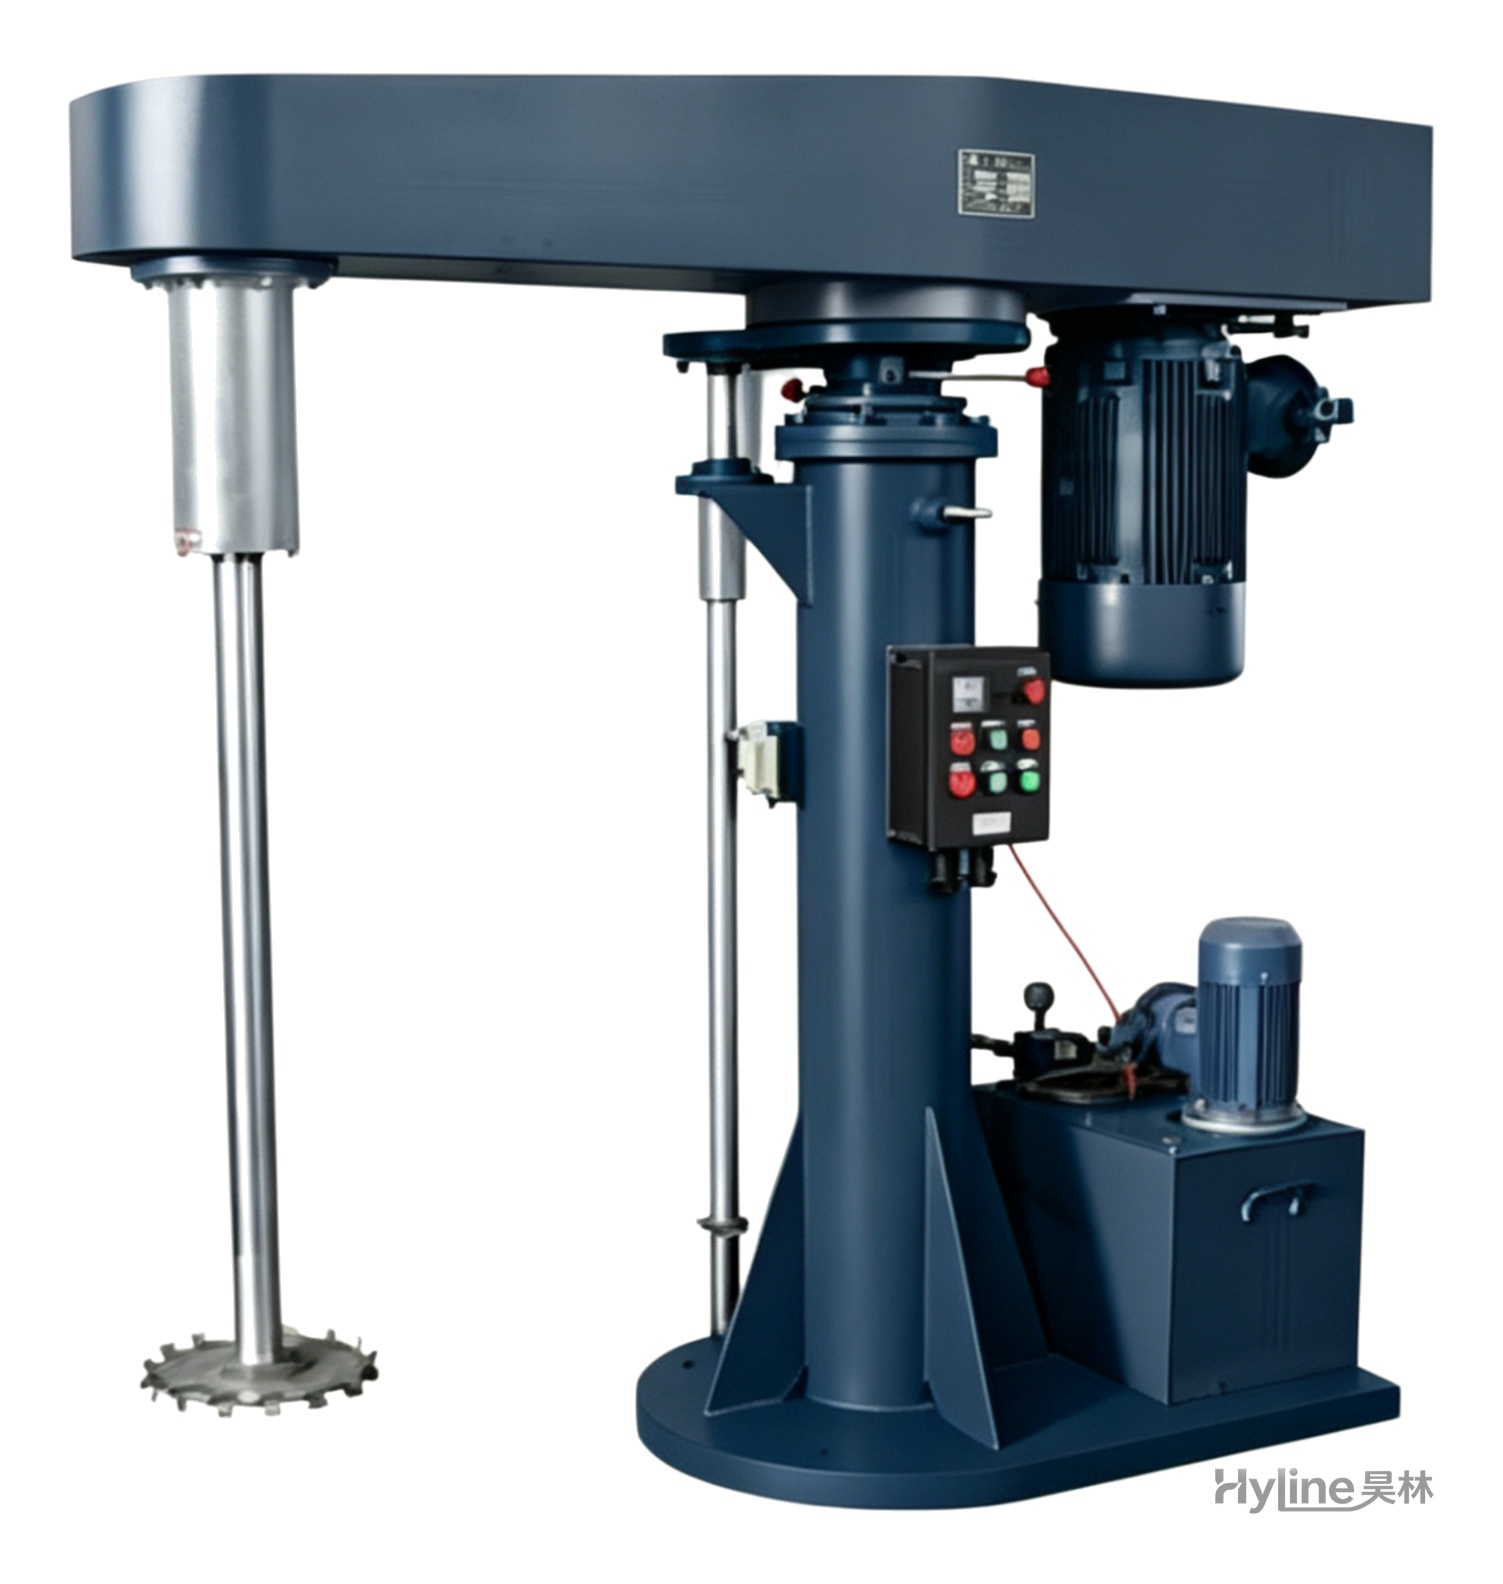
FL Series High-Speed Disperser
Stirs, dissolves and disperses liquids and powders, working alone or matched with sand mills. Variable-frequency drive with hydraulic lift, widely used in paints, inks, coatings, dyestuffs and papermaking.
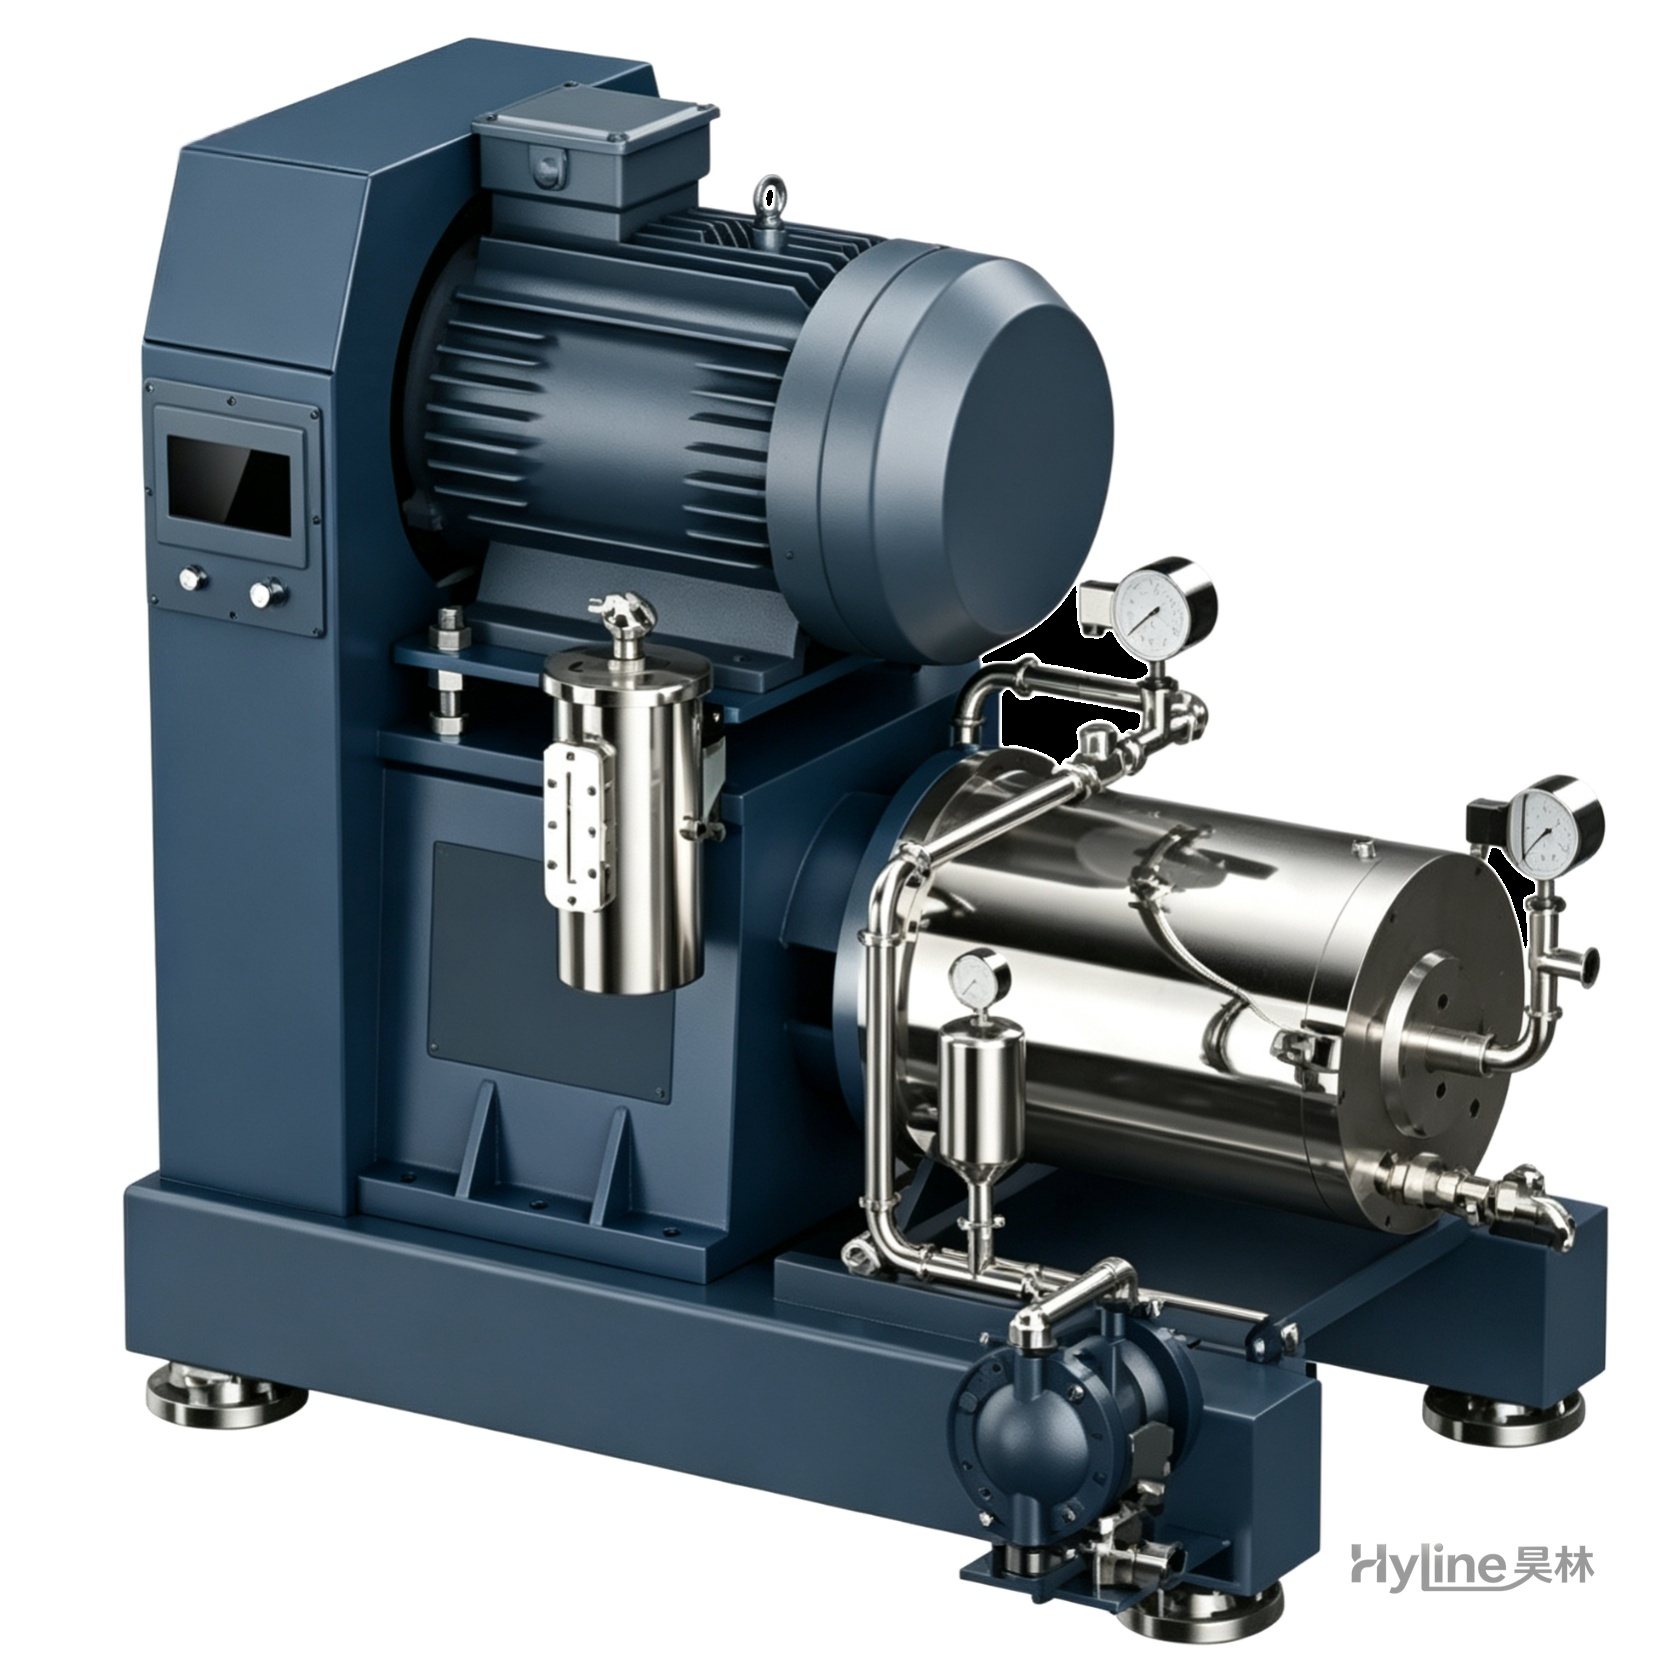
TDB Nano Sand Mill (Rod Pin Type)
Designed to advanced European standards with ample flow, excellent temperature control and high energy efficiency, achieving narrow particle size distribution at nano grade. Widely used in ceramics, inks, lithium battery materials, electronic slurries, nano pastes and pesticides.
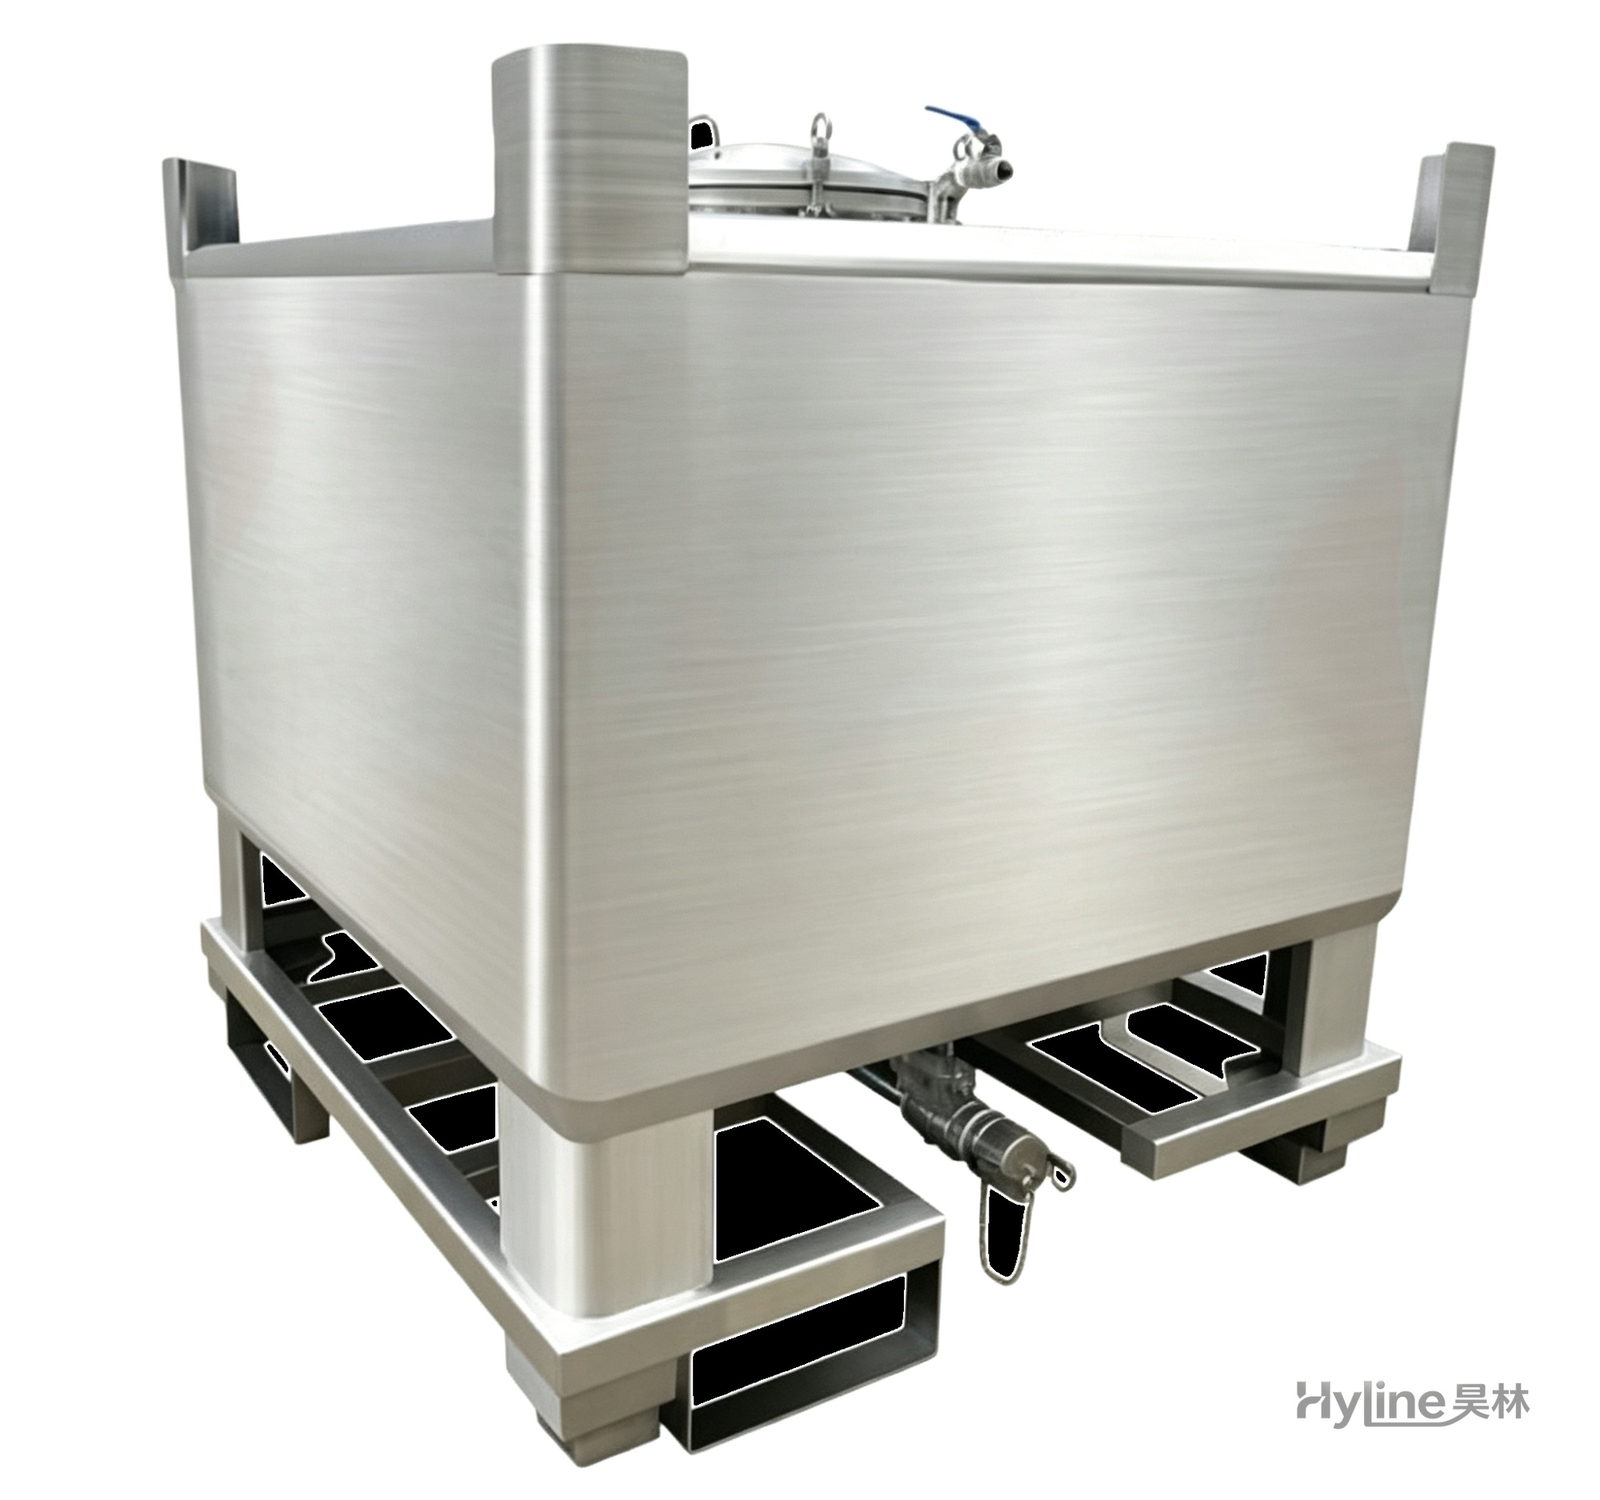
IBC Tank (Intermediate Bulk Container)
HDPE blow-molded liner with hot-dip galvanized steel frame - UV resistant, anti-aging, easy to clean, non-toxic. Four-way fork base for easy handling and stacking; ideal for liquid storage and transport.